
First of all, for data visualization, you need data. So I had previously downloaded and scrubbed a database from the United Nations containing data for women’s share of the workforce in a 189 countries from 1985 to 2006. The list of countries included in the database can be found here: https://github.com/AdhamChakohi/IntrotoIm/blob/master/list%20of%20countries.txt
The original database can be found here: http://data.un.org/Data.aspx?d=GenderStat&f=inID%3a107
I had previously ran the database through a python script to clean it up and remove the unnecessary data, and also add the average and medians across the years for each country. Here’s the python script:
# gets median and average for each country
def hasNumbers(inputString):
    return any(char.isdigit() for char in inputString)

def getStats(file, country):
    country = country.lower()
    fp = open(file, 'r')
    listSum = 0
    counter = 0
    medianList = []
    for i in fp:
        i = i.strip().split(',')
        if i[0][1:-1].lower() == country:
            print(i)
            medianList.append(float(i[5][1:-1]))
            counter += 1
            listSum += float(i[5][1:-1])
    mid = findMiddle(medianList)
    return round(listSum/counter,1), mid

# finds the middle of the list for the purpose of finding the median
def findMiddle(x):
    mid = float(len(x))/2
    if mid%2 == 0:
        return (x[int(mid)]+x[int(mid-1)])/2
    else:
        return x[int(mid-.5)]

def main():
    file_name = "dataset.csv"
    fp = open(file_name,'r')
    target = file_name[:-4]+"_out.csv"
    t = open(target,'w')
    lines_read,lines_written = 0,0
    t.write('country,year,percentage,average across the years,median\n')

    for i in fp:
        current = i.strip().split(",")
        # print(current[0])
        if any(j.isdigit() for j in i) and not hasNumbers(current[0][1:-1]):
            #the [1:-1] indexes are the remove the quotation marks that the data entries come in
            average, median = getStats(file_name,current[0][1:-1])
            written = current[0][1:-1]+","+current[2][1:-1]+","+current[5][1:-1]+","+str(average)+","+str(median)+"\n"
            # print(written)
            t.write(written)

main()
This is code that I have written months ago, and I just found out I had a bug that was removing the data for around 50 countries from the database, so I fixed that. Moving on, the data visualization:
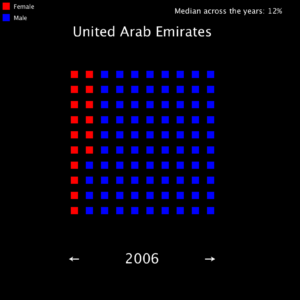
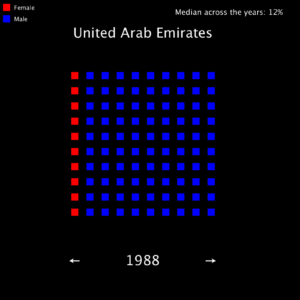
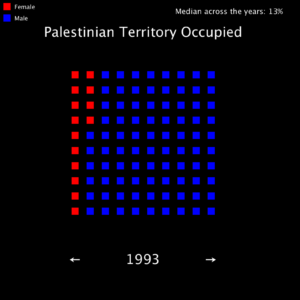
I made this sort of applet, that visualizes women’s share of the workforce for the country that is entered, and with the ability to scroll through the different years available by pressing the left and right keys. There are a 100 squares displayed, the red squares representing female workers, and blue representing the male workers.
more pictures:
The code :
String countryInput = "Palestinian Territory Occupied";

Table table;
float[][] stats = new float[22][3];
int counter = 0;
int pointer = 0;

void setup() {
  size(800, 800);
  table = loadTable("dataset_out.csv", "header,csv");
  for (TableRow row : table.rows()) {
    String country = trim(row.getString("country"));
    if (country.equals(countryInput)) {
      float year = row.getFloat("year");
      float percentage = row.getFloat("percentage");
      float median = row.getFloat("median");
      stats[counter][0] = year;
      stats[counter][1] = percentage;
      stats[counter][2] = median;
      counter++;
    }
  }
  rectMode(CENTER);
}


void draw() {
  int count2 = 0;
  int percent = round((stats[pointer%22][1]/100)*100);

  //println(stats[pointer][1],count2,conv);
  background(0);
  fill(255,0,0);
  rect(20,20,20,20);
  fill(0,0,255);
  rect(20,50,20,20);
  fill(255, 255, 255);
  textAlign(LEFT);
  textSize(16);
  text("Female",40,27);
  text("Male",40,57);
  textSize(20);
  textAlign(RIGHT);
  text("Median across the years: "+str(round(stats[pointer%22][2]))+"%",750,40);
  textAlign(CENTER);
  textSize(36);
  text(str(round(stats[pointer%22][0])), 380, 700);
  text(countryInput, 380, 100);
  stroke(10);
  text("\u2190", 200,700);
  text("\u2192", 560,700);
  for (int i = 200; i<600; i+=40) {
    for (int j = 200; j<600; j+=40) {
      if (count2<=percent) {
        fill(255, 0, 0);
      } else {
        fill(0, 0, 255);
      }
      stroke(0);
      rect(i, j, 20, 20);

      count2++;
    }
  }
}

void keyPressed() {
  println(pointer);
  if (key==CODED) {
    if (keyCode == LEFT) {
      pointer++;
    } else if (keyCode == RIGHT) {
      if (pointer == 0) {
        pointer = 21;
      } else {
        pointer--;
      }
    }
  }
}
All the files can be downloaded from here:
https://github.com/AdhamChakohi/IntrotoIm