DIY Non-Destructive Earthquake!

(Although I think this project may seem easy to some of you, for a coding noob like me who had no experience of coding before this class, I’m pretty proud of what I have done!)

I decided that for this week’s project, I wanted to work on my Earthquake text from last class – hoping that I could also incorporate Aaron’s suggestion of getting the background to move as well.

I started off with getting Processing to talk to Arduino first because I thought that in terms of the coding, it was easier for me to understand. I decided that I wanted to have some sort of “alarming” factor that happens when the Earthquake happens and what better way to catch someone’s attention by using blinking LEDs, right?

I wanted to write some piece of code that when the earthquake shakes, there would be an initial delay in the LED blinking to replicate the real-life situation (according to my geography studies, earthquakes are unpredictable and cannot be predicted until a few seconds before the earthquake and therefore when the earthquake actually happens, the alarms are already late). The blinking code was fairly easy, codes that we learned in the first week or two of class. I made it compatible with Processing, that when I pressed on the mouse, the letters would shake and the LED would blink rapidly. However, what I realised is that even though I did not have a delay at the beginning of the code that declared a delay in the blinking, the code did exactly what I wanted it to do. Cool, yay! I got something to work!

So came the hard part, and it all went downhill from there. My joy went from 100 to 0 real quick. It was time for me to get Arduino to talk to Processing. This process for me kind of felt like talking to a cat, sometimes it would respond but most of the times it wouldn’t care about you at all. Processing was the cat in this case. My next line of action was to connect an accelerometer to my Arduino and make it so that when somebody shakes my board, the letters on the screen shakes with the motion. To get to this goal, I needed to learn first how an accelerometer worked first (I got inspired to use this through Romeno’s project from a while back). I knew that from the accelerometer, I would get 3 different values for each reading, 1 for the x-axis, 1 for the y-axis, and 1 for the y-axis. I thought that it would be easier to take just one value for each reading, and stuck with just receiving the values in the x-axis only.

I got the accelerometer to work, found out the x-value in the initial position, but I didn’t know how to proceed. I knew I needed to write a piece of code in Arduino that would pick-up a large movement in the accelerometer. Aaron suggested that I could add the three axes together and keep a running count of the sum. Then if the difference between the current sum and a previous sum maybe 10 frames ago is greater than a certain threshold then that could be considered as a trigger. I thought that using the sum of the 3 axes was a good idea: first, there would be a larger difference in the sum every movement as it takes into account changes in all axes, and second, it would be easier to manipulate and use in terms of my code as it takes into account all types of movement of the accelerometer rather than simply the x-values that I was using before.

Okay, I got the sum. From there, I was once again stuck on how to proceed and use this sum. I decided to take a break from my code and actually draw out a flow chart of what my goal is and how I needed to get there through coding. I realised after a while that in order for me to get the letters to move through the movement in the accelerometer, I had to have some input that shows the change between the current sum of the axes and the initial sum. From the serial monitor in Arduino, I found that the initial sum was around 1074. The difference between the new sum and the initial sum would thus be something like difference = new sum – 1074. I realised I had to make this a variable and insert an if () function that would shake the letters if the difference is greater than a certain number. Inputting a random number and uploading both the code from Arduino and Processing, (here’s where everything was nice again) I REALISED THAT MY CODE WORKED! When I shook my board, the letters vibrated as well.

I wanted to implement the suggestion that Aaron gave me last week – to get the background image to vibrate as well. With help from a friend, I realised that a background wouldn’t be able to vibrate and rather I had to get the soil background to be an image that would look like a background but isn’t actually a background but only an image instead. I had to also make sure that the screen size and the image were different sizes, the image had to be bigger so that when the image shook, there wouldn’t be some vibration that would reveal the coloured background in the back. My friend suggested that I made the image shake using a boolean, meaning that it would either shake or not shake depending on the situation. I had to play around with the “translation” aspect of the image, changing numbers to make sure that when it did shake, there would be vibrations across the whole screen and not only at certain parts. The image vibration and shake that I ended up with has a random movement, like the letters.

Voilà. I did it. I actually finished my project.

To sum up what my project does:

  1. If you shake the board which has the accelerometer attached to it, the letters would shake and move around arbitrarily,
  2. While the letters are moving around arbitrarily, the background is also moving in a vibrating, earthquake-movement, random fashion,
  3. After a short delay of a second-ish after the earthquake has started, the LED would start blinking quickly and would stop blinking a second-ish after the earthquake has ended (replicating the real-life situation of alarms during earthquakes).
  4. (The space bar still brings everything back to the home position).

Here is a video of how it works:

Here is a screen-capture of both the letters and the background moving:

Here is the Arduino code:

void setup()
{
  Serial.begin(9600);      
  Serial.write(0);
  pinMode(2,OUTPUT);
}

void loop()
{
   int sensorX = analogRead(0);       
   int sensorY = analogRead(1);       
   int sensorZ = analogRead(2);       
 
    float sum = sensorX+sensorY+sensorZ;
    Serial.println (sum);
    delay(10);             
    
    if(Serial.available()>0){
    int inByte=Serial.read();
    
    if (inByte == 1){
      digitalWrite(2, HIGH);   
      delay(10);               
      digitalWrite(2, LOW);    
      delay(10); 

    if (inByte == 0){
      digitalWrite(2, LOW);
    }
}
    }
    int sensor = analogRead(A0);
    delay(0);
    sensor/=4;
    Serial.write(sensor);
  }

Here is the Processing code:

Main page:

import processing.serial.*;
Serial myPort;

import geomerative.*;
RFont font;
//PImage bg;
PImage img;
String message = "EARTHQUAKE";
int i;
String val;

Letter[] letters;

boolean imageShake = false;

int xPos=0;

void setup() {
  //size(900, 600);
  size (800, 500);
  //bg = loadImage ("soil.jpg");
  img = loadImage ("soil.jpg");
  background(255);
  textSize (70);

  RG.init(this);
  font = new RFont("Courier New Bold.ttf", 1000);

  letters = new Letter[message.length()];
  int x = 200;
  for (int i = 0; i < message.length(); i++) {
    letters[i] = new Letter(x, 280, message.charAt(i));
    x += textWidth(message.charAt(i));
  }

  printArray(Serial.list());
  String portname=Serial.list()[4];
  println(portname);
  myPort = new Serial(this, portname, 9600);
  myPort.clear();
  myPort.bufferUntil('\n');
}


void draw() {
  //background(bg);

  if (imageShake == true) {
    image(img, -50 + random(-25, 25) , -50 + random(-25, 25));
  } else {
    image(img, -50, -50);
  }
  for (int i = 0; i < letters.length; i++) {
    letters[i].display();     // Display all letters
  }
}

float diff;

void serialEvent(Serial myPort) {
   xPos=myPort.read();
   myPort.write(0);
  
  String s = myPort.readStringUntil('\n');
  s=trim(s);

  if (s!=null) {
    //int values[]=int(split(s,'\n'));
    float value = float(s);
    diff = abs(value - 1074.0);
    if (diff>25) {
      for (int i = 0; i<letters.length; i++) {
        letters[i].shake();
        imageShake = true;
        myPort.write(1);
      }
    } else {
      for (int i = 0; i<letters.length; i++) {
        letters[i].secondPosition();
        imageShake = false;
        myPort.write(0);
      }
    }
    if (keyPressed) {
      for (int i = 0; i<letters.length; i++) {
        letters[i].home();
      }
    }
  }
}

Class page (same as last week):

class Letter {
  char letter;
  float homex, homey;
  float x, y;

  Letter (float _x, float _y, char _letter) {
    homex = x = _x;
    homey = y =_y;
    letter = _letter;
  }

  void display() {
    fill(255);
    textAlign(CENTER);
    text(letter, x, y);
  }

  void shake() {
    x += random(-8, 8);
    y += random(-8, 8);
  }

  void secondPosition() {
    lerp(x, homex, 0.07);
    lerp(y, homey, 0.07);
  }
  
  void home() {
    x = lerp(x, homex, 0.01);
    y = lerp(y, homey, 0.01);
  }
}

This project took me a very very long time. I would like to thank my friend, Navya, for explaining concepts to me and for helping me understand what the logic behind my project and helping me envision what my code needs to look like and ultimately helping me reach the end goal (aka this project). I think that I learned a lot about programming from this assignment, though it did stress me out a lot. Overall, I am happy with what the project turned out to be!

Week 10 project

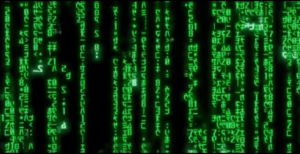
This week I was inspired by the movie ‘The Matrix’. There is the iconic ‘matrix’ coding that can fill a screen with random falling code and it looks… awesome. This is a picture of what I’m talking about:

I searched online for anyone who had done the coding for this and I found someone who had. I used their code as a backbone for what I wanted to do. My idea was to alter the lettering and make it so that it spells my name. I didn’t want the coding to be too obvious that it was my name so I altered it so that each letter would come down randomly. I got some help from Alex to figure out how to do this.  We made some mistakes which made the falling code stop after 7 letters had fallen. Therefore, we hardcoded the letters to have 98 characters in total.

I altered the original code as well as some of the numbers didn’t make sense due to the fact that the original author had put non numeric code inside of a size().

This is the final code:

int y = -400; // initial baseline y position
int size_x = 1000; 
int size_y = 500;
int text_size = 10;
int max_num_col = 98; 
int num_col = floor(random(1,max_num_col)); // randomize total num of columns to be created for each loop
int[] xPosi;   // array to store random initial x positions 
int[] yOffset; // array to store random initial y position offset
//String name = "vitoria"; 
char[] poo = {'v', 'i', 't', 'o', 'r', 'i', 'a','v', 'i', 't', 'o', 'r', 'i', 'a','v', 'i', 't', 'o', 'r', 'i', 'a','v', 'i', 't', 'o', 'r', 'i', 'a','v', 'i', 't', 'o', 'r', 'i', 'a','v', 'i', 't', 'o', 'r', 'i', 'a','v', 'i', 't', 'o', 'r', 'i', 'a','v', 'i', 't', 'o', 'r', 'i', 'a','v', 'i', 't', 'o', 'r', 'i', 'a','v', 'i', 't', 'o', 'r', 'i', 'a','v', 'i', 't', 'o', 'r', 'i', 'a','v', 'i', 't', 'o', 'r', 'i', 'a','v', 'i', 't', 'o', 'r', 'i', 'a','v', 'i', 't', 'o', 'r', 'i', 'a'};
 
void setup(){
  size(1000, 500); 
  frameRate(60); 
  colorMode(HSB,360,100,100);
  
  PFont font; 
  font = createFont("Arial Black", 10); 
  textFont(font);
  
  xPosi   = new int[num_col]; 
  yOffset = new int[num_col];  
  
  for (int i=0; i<num_col; i=i+1) {
    xPosi[i]   = floor(random(size_x/text_size))*text_size;
    yOffset[i] = floor(random(-size_y,size_y));
  }
}

void draw(){
  fill(0,10); // the smaller the alpha, the longer the tail
  noStroke(); 
  rect(0,0,size_x,size_y);   
  
//  fill(random(360),100,100); // char with color
  fill(120,100,100); // green char
  textSize(text_size);
  
  for (int i=0; i<num_col; i++) {
    //int i_char = floor(random(255));
    //char T = char(i_char);
    char T = poo[i];
    text(T, xPosi[i], y+yOffset[i]);
  }
  
  y = y + floor(text_size/1.1); // spacing btw char  
  if (y>size_y*1.2) {
    y = -400;
    num_col = floor(random(1,max_num_col));
    xPosi   = new int[num_col]; 
    yOffset = new int[num_col];
    for (int i=0; i<num_col; i=i+1) {
      xPosi[i]   = floor(random(size_x/text_size))*text_size;
      yOffset[i] = floor(random(-size_y,size_y));
    }
  }
}

The product looks like this:

It’s a bit empty, but I’m happy with the results.

The Digitalisation of Just About Everything – Response

I found the part related to the social data especially interesting as I had come across very similar content in a book about psychology and statistics. The idea that tweets can be used to predict movie box-office revenue was very interesting as seemingly independent data can be used to make predictions which can result in huge economic benefit. To mention that so much of the work that humans used to do has been replaced by machines and technology is probably stating the obvious, however, this reading made me really realise that so much can be done with the collected and stored data and wonder how much more can be done with the new technology to come.

Life and Death Data Visualization Project

So for my project this week I wanted to do some data visualization that could be regarded, “live”. I got some interesting rates of from http://www.ecology.com/birth-death-rates/ where I found that the rate of birth worldwide is about 4 every second and the rate of death as 1.78 every second.

The idea was to basically show the user how many people have born and died since they opened the application and perhaps make them understand the importance of life by its fragility and beauty.

I used this data to implement a simple data visualization which you can see in the video below:

I randomly switched from the ‘lifeMode’ to the ‘deathMode’ with a 0.02 probability every 1/60th of a second and played a heart beat sound when it changes to give this visualization a more rushed feel.

I used the simple black and white color scheme to make it simple for the user to understand what is death and being born as it can be commonly derived that white represents life and black represents death.

The user can switch to and fro from death and life by clicking anywhere. And as some type of easter egg I implemented a system where it recognizes how long you stay in either the life or death by clicking and displays it in a pie chart if you press any key on your keyboard (as you can see towards the end of the youtube video). This basically is a type of personality test which shows the user whether they focus of life or death more.


float seconds,deaths,births;
float currentRadius=0;
int d = 0;
boolean lifeMode=true; //default lifeMode value is true which is the number of people born will be displayed first
boolean probability(float prob) { float value=random(0,1); if(prob>value) { return true; } else { return false; } } //probability function
boolean startControl=false;
boolean counting=false;
float lifePoints=1;float deathPoints=1;
boolean debug=false;
int[] angles={180,180};
void setup() {
  fullScreen();
//size(640,420);
  smooth();
  frameRate(60);
}

void draw() {
  //println((lifePoints/(lifePoints+deathPoints))*100 + " life percentage and" + (deathPoints/(lifePoints+deathPoints))*100);
  float lifePercent=((lifePoints)/(lifePoints+deathPoints))*360;
  float deathPercent=(deathPoints)/(lifePoints+deathPoints)*360;
  angles[0]=int(lifePercent);
  angles[1]=int(deathPercent);
  if(!debug){
  println(lifePercent + " --- " + deathPercent);
  if(lifeMode) { background(0);fill(255); if(counting) {lifePoints+=1;} } else { background(255);fill(0);if(counting) {deathPoints+=1;} } //switch bg color depending on mode
if(probability(0.01)) { changeLifeMode(true); } //switch mode randomly with a probability of 0.01
seconds = frameCount/60; 
deaths=(seconds*1.78); //1.78 deaths per second
births=(seconds)/0.25; //4 deaths per second
float rate=births-deaths;
if(rate>=currentRadius) {
currentRadius+=0.5; //to smoothe the radius increase rather than mapping the rate directly to radius
}
int scaler;
if(lifeMode) {scaler=4;} else {scaler=2;} 
noStroke();
ellipse(width/2,height/2,currentRadius*scaler,currentRadius*scaler);
if(lifeMode) { fill(0);textSize(16 + 16*currentRadius*0.02); } else { fill(255);textSize(16 + 16*currentRadius*0.01); }

textAlign(LEFT,CENTER);
String msg;
float textPlace;
if(lifeMode) { msg=int(births)+" born.";textPlace=(currentRadius*0.02*2+msg.length()*2); } else { msg=int(deaths)+" dead.";textPlace=(currentRadius*0.01*2+msg.length()*1.5); }
if(lifeMode) { text(msg , width/2-2.5*(textPlace), height/2);  } else { text(msg, width/2-2.5*(textPlace)-20, height/2); } //displaying text depending on mode
fill(255);
} else {
  background(200);
  float lifePercent2=((lifePoints)/(lifePoints+deathPoints))*100;
  float deathPercent2=(deathPoints)/(lifePoints+deathPoints)*100;
  pieChart(300, angles);
  fill(0);
  textSize(18);
  text("Life focus percent: " + lifePercent2 + "%" ,0.1*width,height*0.9);
  text("Death focus percent: " + deathPercent2 + "%" ,0.6*width,height*0.9);
}
}
void changeLifeMode(boolean auto) {
lifeMode=!lifeMode;
if(auto) {
counting=false;
}
}
void mousePressed() {
  counting=true;
startControl=true;
changeLifeMode(false);
}

void keyPressed() {
debug=!debug;
}

void pieChart(float diameter, int[] data) {
  float lastAngle = 0;
  for (int i = 0; i < data.length; i++) { 
    if(i==0) { fill(255); } else if(i==1) { fill(0); }
    
    arc(width/2, height/2, diameter, diameter, lastAngle, lastAngle+radians(data[i]));
    lastAngle += radians(data[i]);
  }
}


Assignment 8

Following with my assignment from last week which made several shapes vibrate, I wanted to make the letters vibrate for this week’s assignment.

I also wanted to incorporate some human quality into the project so I thought of the  vibrating motion as “tickling” and I made the letters “run away” from the mouse which “tickles” them.

import geomerative.*;
String text = "Yoon Hee";

float x = 190;
float y = 180;

void setup() {
size(640, 360);
background(255);
textSize(50);
noStroke();
}

void draw() {
fill(204);
rect(0, 0, width, height);
fill(0);
text("Yoon Hee", x, y);

if (mousePressed == true) {
x += random(-2, 2); 
y += random(-2, 2); 
text("Yoon Hee", x, y);
} else {
text("Yoon Hee", x, y);
}
}

void mousePressed() {
if ((mouseX >= x) && (mouseX <= x+30) &&
(mouseY >= y-5) && (mouseY <= y)) {
x += random(-2, 2); 
y += random(-2, 2);
}
}


Generative Text Design

I originally wanted to create something similar to the animated text memes that you scroll upon on social media, for example: GIF 1  and  GIF 2. I really enjoy how the text moves in a wave-like motion and the three-dimensional appeal of it.

However, this weekend was extremely rough with work and I wasn’t able to dedicate enough time to creating something to the examples demonstrated above. I decided to create something else, which I was inspired to do after looking at this artwork. I really liked the concept of words falling down in a random order, people being able to interact with the text through their bodies, and form actual words which translated into poems. I wanted to re-create something similar, but because I didn’t have enough knowledge (or frankly, time) to create a body sensor and somehow combine that with my code, I decided to do something similar on a smaller scale.

My final project can be found here. I had trouble thinking about ways I can make the project interactive without a body sensor. I decided to use something related to what we have learned about making things interactive on processing – I decided to use keyPressed(). The idea was to make random letters fall, and somehow arrange them into words when I click on the letters. However, I found that too difficult to code and opted for something slightly simpler. I found a tutorial that helped me do something similar to the idea, instead of the words falling on their own, the individual who is interacting would type any word, and the letters would be placed one by one in a random order across the screen. The letters wouldn’t completely disappear once typed, instead, I made them fade into the background for a nicer effect. The outcome isn’t what I initially wanted, and it’s not something I am really happy with considering the lack of time and energy I dedicated to this due to an incredibly busy week.

Data Visualization

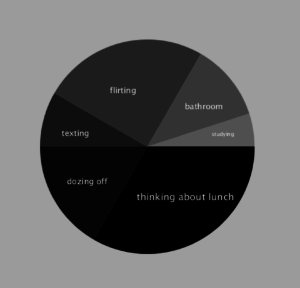
I interviewed some individuals from my computer science classes about the things that they actually do during class and consolidated the responses into 6 main categories: thinking about lunch, dozing off, texting, flirting, using the bathroom, and actually studying. I then visualized the data via a pie chart that I created using arcs.

I created the data by assigning values (minutes) to each category based on the responses. I then generated the start and stop markers for each slice of the pie by calculating the percentage of class time spent doing each task.

This is a screenshot of my chart:

This is my code:

float data[];
float total = 0;
float StempVar = 0;
float EtempVar = 0;

size(600,600);
String[] input = loadStrings(“input.txt”);
println(input.length);
data = float(split(input[0], ‘,’));
println(data.length);
noStroke();
for(int i = 0; i < data.length; i++){
total = total + data[i];
println(total);
}
//for(int a = 0; a < data.length; a++){
// println(data[a]);
//}

for(int i = 0; i < data.length; i++){
//int colour = int(random(0,255));
fill(i*30);
StempVar = StempVar + (2*(data[i]/total));
//println(StempVar);
EtempVar = (StempVar – 2*(data[i]/total));
println(EtempVar);
arc(300, 300, 400, 400, EtempVar*PI, StempVar*PI);
}

fill(255);
textSize(18);
text(“thinking about lunch”, 280, 400);
textSize(15);
text(“dozing off”, 150, 370);
text(“texting”, 140, 280);
text(“flirting”, 230, 200);
text(“bathroom”, 370, 230);
textSize(10);
text(“studying”, 420, 280);

Digitize Everything

The author mentioned facebook being the most popular internet site in the world. With companies like facebook and google which are extremely useful and very widely utilized by the world, and are also free to use, then you become not the customer of those sites but the products. The way these companies turn a profit is by selling your data, that they have amassed plenty of by y0u using their services, to advertisers. This has become increasingly apparent in the past month when it was discovered that this data mining by advertisers was used to influence the 2016 US presidential elections. This is the problem, when it is this easy to collect data in our digital age, especially data about people, we lose privacy.