Week 10 project

This week I was inspired by the movie ‘The Matrix’. There is the iconic ‘matrix’ coding that can fill a screen with random falling code and it looks… awesome. This is a picture of what I’m talking about:
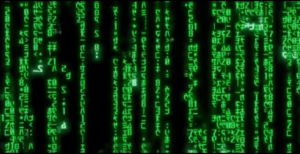
I searched online for anyone who had done the coding for this and I found someone who had. I used their code as a backbone for what I wanted to do. My idea was to alter the lettering and make it so that it spells my name. I didn’t want the coding to be too obvious that it was my name so I altered it so that each letter would come down randomly. I got some help from Alex to figure out how to do this.  We made some mistakes which made the falling code stop after 7 letters had fallen. Therefore, we hardcoded the letters to have 98 characters in total.

I altered the original code as well as some of the numbers didn’t make sense due to the fact that the original author had put non numeric code inside of a size().

This is the final code:

int y = -400; // initial baseline y position
int size_x = 1000; 
int size_y = 500;
int text_size = 10;
int max_num_col = 98; 
int num_col = floor(random(1,max_num_col)); // randomize total num of columns to be created for each loop
int[] xPosi;   // array to store random initial x positions 
int[] yOffset; // array to store random initial y position offset
//String name = "vitoria"; 
char[] poo = {'v', 'i', 't', 'o', 'r', 'i', 'a','v', 'i', 't', 'o', 'r', 'i', 'a','v', 'i', 't', 'o', 'r', 'i', 'a','v', 'i', 't', 'o', 'r', 'i', 'a','v', 'i', 't', 'o', 'r', 'i', 'a','v', 'i', 't', 'o', 'r', 'i', 'a','v', 'i', 't', 'o', 'r', 'i', 'a','v', 'i', 't', 'o', 'r', 'i', 'a','v', 'i', 't', 'o', 'r', 'i', 'a','v', 'i', 't', 'o', 'r', 'i', 'a','v', 'i', 't', 'o', 'r', 'i', 'a','v', 'i', 't', 'o', 'r', 'i', 'a','v', 'i', 't', 'o', 'r', 'i', 'a','v', 'i', 't', 'o', 'r', 'i', 'a'};
 
void setup(){
  size(1000, 500); 
  frameRate(60); 
  colorMode(HSB,360,100,100);
  
  PFont font; 
  font = createFont("Arial Black", 10); 
  textFont(font);
  
  xPosi   = new int[num_col]; 
  yOffset = new int[num_col];  
  
  for (int i=0; i<num_col; i=i+1) {
    xPosi[i]   = floor(random(size_x/text_size))*text_size;
    yOffset[i] = floor(random(-size_y,size_y));
  }
}

void draw(){
  fill(0,10); // the smaller the alpha, the longer the tail
  noStroke(); 
  rect(0,0,size_x,size_y);   
  
//  fill(random(360),100,100); // char with color
  fill(120,100,100); // green char
  textSize(text_size);
  
  for (int i=0; i<num_col; i++) {
    //int i_char = floor(random(255));
    //char T = char(i_char);
    char T = poo[i];
    text(T, xPosi[i], y+yOffset[i]);
  }
  
  y = y + floor(text_size/1.1); // spacing btw char  
  if (y>size_y*1.2) {
    y = -400;
    num_col = floor(random(1,max_num_col));
    xPosi   = new int[num_col]; 
    yOffset = new int[num_col];
    for (int i=0; i<num_col; i=i+1) {
      xPosi[i]   = floor(random(size_x/text_size))*text_size;
      yOffset[i] = floor(random(-size_y,size_y));
    }
  }
}

The product looks like this:
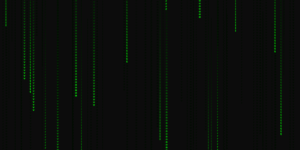
It’s a bit empty, but I’m happy with the results.

The Digitalisation of Just About Everything – Response

I found the part related to the social data especially interesting as I had come across very similar content in a book about psychology and statistics. The idea that tweets can be used to predict movie box-office revenue was very interesting as seemingly independent data can be used to make predictions which can result in huge economic benefit. To mention that so much of the work that humans used to do has been replaced by machines and technology is probably stating the obvious, however, this reading made me really realise that so much can be done with the collected and stored data and wonder how much more can be done with the new technology to come.

Life and Death Data Visualization Project

So for my project this week I wanted to do some data visualization that could be regarded, “live”. I got some interesting rates of from http://www.ecology.com/birth-death-rates/ where I found that the rate of birth worldwide is about 4 every second and the rate of death as 1.78 every second.

The idea was to basically show the user how many people have born and died since they opened the application and perhaps make them understand the importance of life by its fragility and beauty.

I used this data to implement a simple data visualization which you can see in the video below:

I randomly switched from the ‘lifeMode’ to the ‘deathMode’ with a 0.02 probability every 1/60th of a second and played a heart beat sound when it changes to give this visualization a more rushed feel.

I used the simple black and white color scheme to make it simple for the user to understand what is death and being born as it can be commonly derived that white represents life and black represents death.

The user can switch to and fro from death and life by clicking anywhere. And as some type of easter egg I implemented a system where it recognizes how long you stay in either the life or death by clicking and displays it in a pie chart if you press any key on your keyboard (as you can see towards the end of the youtube video). This basically is a type of personality test which shows the user whether they focus of life or death more.


float seconds,deaths,births;
float currentRadius=0;
int d = 0;
boolean lifeMode=true; //default lifeMode value is true which is the number of people born will be displayed first
boolean probability(float prob) { float value=random(0,1); if(prob>value) { return true; } else { return false; } } //probability function
boolean startControl=false;
boolean counting=false;
float lifePoints=1;float deathPoints=1;
boolean debug=false;
int[] angles={180,180};
void setup() {
  fullScreen();
//size(640,420);
  smooth();
  frameRate(60);
}

void draw() {
  //println((lifePoints/(lifePoints+deathPoints))*100 + " life percentage and" + (deathPoints/(lifePoints+deathPoints))*100);
  float lifePercent=((lifePoints)/(lifePoints+deathPoints))*360;
  float deathPercent=(deathPoints)/(lifePoints+deathPoints)*360;
  angles[0]=int(lifePercent);
  angles[1]=int(deathPercent);
  if(!debug){
  println(lifePercent + " --- " + deathPercent);
  if(lifeMode) { background(0);fill(255); if(counting) {lifePoints+=1;} } else { background(255);fill(0);if(counting) {deathPoints+=1;} } //switch bg color depending on mode
if(probability(0.01)) { changeLifeMode(true); } //switch mode randomly with a probability of 0.01
seconds = frameCount/60; 
deaths=(seconds*1.78); //1.78 deaths per second
births=(seconds)/0.25; //4 deaths per second
float rate=births-deaths;
if(rate>=currentRadius) {
currentRadius+=0.5; //to smoothe the radius increase rather than mapping the rate directly to radius
}
int scaler;
if(lifeMode) {scaler=4;} else {scaler=2;} 
noStroke();
ellipse(width/2,height/2,currentRadius*scaler,currentRadius*scaler);
if(lifeMode) { fill(0);textSize(16 + 16*currentRadius*0.02); } else { fill(255);textSize(16 + 16*currentRadius*0.01); }

textAlign(LEFT,CENTER);
String msg;
float textPlace;
if(lifeMode) { msg=int(births)+" born.";textPlace=(currentRadius*0.02*2+msg.length()*2); } else { msg=int(deaths)+" dead.";textPlace=(currentRadius*0.01*2+msg.length()*1.5); }
if(lifeMode) { text(msg , width/2-2.5*(textPlace), height/2);  } else { text(msg, width/2-2.5*(textPlace)-20, height/2); } //displaying text depending on mode
fill(255);
} else {
  background(200);
  float lifePercent2=((lifePoints)/(lifePoints+deathPoints))*100;
  float deathPercent2=(deathPoints)/(lifePoints+deathPoints)*100;
  pieChart(300, angles);
  fill(0);
  textSize(18);
  text("Life focus percent: " + lifePercent2 + "%" ,0.1*width,height*0.9);
  text("Death focus percent: " + deathPercent2 + "%" ,0.6*width,height*0.9);
}
}
void changeLifeMode(boolean auto) {
lifeMode=!lifeMode;
if(auto) {
counting=false;
}
}
void mousePressed() {
  counting=true;
startControl=true;
changeLifeMode(false);
}

void keyPressed() {
debug=!debug;
}

void pieChart(float diameter, int[] data) {
  float lastAngle = 0;
  for (int i = 0; i < data.length; i++) { 
    if(i==0) { fill(255); } else if(i==1) { fill(0); }
    
    arc(width/2, height/2, diameter, diameter, lastAngle, lastAngle+radians(data[i]));
    lastAngle += radians(data[i]);
  }
}


Assignment 8

Following with my assignment from last week which made several shapes vibrate, I wanted to make the letters vibrate for this week’s assignment.

I also wanted to incorporate some human quality into the project so I thought of the  vibrating motion as “tickling” and I made the letters “run away” from the mouse which “tickles” them.

import geomerative.*;
String text = "Yoon Hee";

float x = 190;
float y = 180;

void setup() {
size(640, 360);
background(255);
textSize(50);
noStroke();
}

void draw() {
fill(204);
rect(0, 0, width, height);
fill(0);
text("Yoon Hee", x, y);

if (mousePressed == true) {
x += random(-2, 2); 
y += random(-2, 2); 
text("Yoon Hee", x, y);
} else {
text("Yoon Hee", x, y);
}
}

void mousePressed() {
if ((mouseX >= x) && (mouseX <= x+30) &&
(mouseY >= y-5) && (mouseY <= y)) {
x += random(-2, 2); 
y += random(-2, 2);
}
}


Generative Text Design

I originally wanted to create something similar to the animated text memes that you scroll upon on social media, for example: GIF 1  and  GIF 2. I really enjoy how the text moves in a wave-like motion and the three-dimensional appeal of it.

However, this weekend was extremely rough with work and I wasn’t able to dedicate enough time to creating something to the examples demonstrated above. I decided to create something else, which I was inspired to do after looking at this artwork. I really liked the concept of words falling down in a random order, people being able to interact with the text through their bodies, and form actual words which translated into poems. I wanted to re-create something similar, but because I didn’t have enough knowledge (or frankly, time) to create a body sensor and somehow combine that with my code, I decided to do something similar on a smaller scale.

My final project can be found here. I had trouble thinking about ways I can make the project interactive without a body sensor. I decided to use something related to what we have learned about making things interactive on processing – I decided to use keyPressed(). The idea was to make random letters fall, and somehow arrange them into words when I click on the letters. However, I found that too difficult to code and opted for something slightly simpler. I found a tutorial that helped me do something similar to the idea, instead of the words falling on their own, the individual who is interacting would type any word, and the letters would be placed one by one in a random order across the screen. The letters wouldn’t completely disappear once typed, instead, I made them fade into the background for a nicer effect. The outcome isn’t what I initially wanted, and it’s not something I am really happy with considering the lack of time and energy I dedicated to this due to an incredibly busy week.

Data Visualization

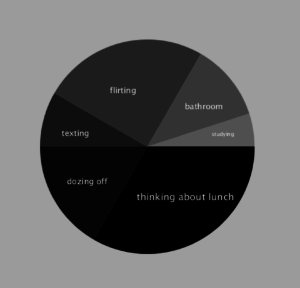
I interviewed some individuals from my computer science classes about the things that they actually do during class and consolidated the responses into 6 main categories: thinking about lunch, dozing off, texting, flirting, using the bathroom, and actually studying. I then visualized the data via a pie chart that I created using arcs.

I created the data by assigning values (minutes) to each category based on the responses. I then generated the start and stop markers for each slice of the pie by calculating the percentage of class time spent doing each task.

This is a screenshot of my chart:

This is my code:

float data[];
float total = 0;
float StempVar = 0;
float EtempVar = 0;

size(600,600);
String[] input = loadStrings(“input.txt”);
println(input.length);
data = float(split(input[0], ‘,’));
println(data.length);
noStroke();
for(int i = 0; i < data.length; i++){
total = total + data[i];
println(total);
}
//for(int a = 0; a < data.length; a++){
// println(data[a]);
//}

for(int i = 0; i < data.length; i++){
//int colour = int(random(0,255));
fill(i*30);
StempVar = StempVar + (2*(data[i]/total));
//println(StempVar);
EtempVar = (StempVar – 2*(data[i]/total));
println(EtempVar);
arc(300, 300, 400, 400, EtempVar*PI, StempVar*PI);
}

fill(255);
textSize(18);
text(“thinking about lunch”, 280, 400);
textSize(15);
text(“dozing off”, 150, 370);
text(“texting”, 140, 280);
text(“flirting”, 230, 200);
text(“bathroom”, 370, 230);
textSize(10);
text(“studying”, 420, 280);

Digitize Everything

The author mentioned facebook being the most popular internet site in the world. With companies like facebook and google which are extremely useful and very widely utilized by the world, and are also free to use, then you become not the customer of those sites but the products. The way these companies turn a profit is by selling your data, that they have amassed plenty of by y0u using their services, to advertisers. This has become increasingly apparent in the past month when it was discovered that this data mining by advertisers was used to influence the 2016 US presidential elections. This is the problem, when it is this easy to collect data in our digital age, especially data about people, we lose privacy.

The Digitization Of Just About Everything

I found this read extremely fascinating. I really liked the section where the author discussed the economics behind digitization, the way digitization appeals to non-rivalry and zero marginal cost of reproduction. I also thought his discussion of free products was interesting. It is truly captivating how so many creators devote so much time producing amazing online content without expecting anything in return. Although he claimed that free content wasn’t necessarily a bad thing, he didn’t really elaborate on why it was beneficial either. I was hoping he would further unpack this discussion. Lastly, I thought some of the facts he laid down was really interesting. Facts such as if digitization growth grows at the pace it has been growing at, we will run out of the metric system. Or, how the combined level of robotic chatter is soon likely to exceed the sum of all human voice conversations taking place on wireless grids. This read had some really engaging material.

Data Visualization

First, I should note that I could not find the correct library to access the data I was trying to use in Java, so I am using random data.

When presented with this prompt, my first thought was my capstone, which is largely data visualization. However, it uses software I could not recreate in less than a couple years, so I decided to process data similar to my capstone in a visually interesting way. In other words, I wanted to take a large set of floats mapped to 2d space, and group them into maxima. This is a very simple way to describe how stars are found in a digital image, which is roughly what I seek to recreate. I did this, but it was a bit boring, so I also set it up to make a more dynamic image that follows similar logic. These are the two modes in my program, mode 0 is more interesting but mode 1 is more intuitive.

float[][] visualization;
float[][] tempVisualization;
float max=0;
float min=255;
float range=255;
float growthfactor=255;
int mode= 0;
//loat[] data;
ImageHDU imageHdu;
void setup(){
  size(100,100);
  frameRate(15);
  //data = getImageHDUDataInFloatArray(imageHdu);
  visualization= new float[width][height];
  tempVisualization= new float[width][height];
  for(int x= 0; x< width; x++){
    for(int y= 0; y< height; y++){
     visualization[x][y]= random(25);
     //println(visualization[x][y]);
    }
  }
  
}

void draw(){
  min=255;
  max=0;
  for(int x= 1; x< width-1; x++){
    for(int y= 1; y< height-1; y++){
       if(mode==0){
         if(visualization[x][y]>visualization[x][y+1]&&
         visualization[x][y]>visualization[x][y-1]&&
         visualization[x][y]>visualization[x+1][y+1]&&
         visualization[x][y]>visualization[x-1][y+1]&&
         visualization[x][y]>visualization[x+1][y-1]&&
         visualization[x][y]>visualization[x-1][y-1]&&
         visualization[x][y]>visualization[x-1][y]&&
         visualization[x][y]>visualization[x+1][y]){
           tempVisualization[x][y]=visualization[x][y]+
           (visualization[x-1][y]+
           visualization[x-1][y-1]+
           visualization[x][y-1]+
           visualization[x+1][y-1]+
           visualization[x-1][y+1]+
           visualization[x][y+1]+
           visualization[x+1][y+1]+
           visualization[x+1][y])/2;
         }
         else{
           tempVisualization[x][y]=visualization[x][y]-
           (visualization[x-1][y]+
           visualization[x-1][y-1]+
           visualization[x][y-1]+
           visualization[x+1][y-1]+
           visualization[x-1][y+1]+
           visualization[x][y+1]+
           visualization[x+1][y+1]+
           visualization[x+1][y])/9;
         }
       }
     if(mode==1){
       for(int x2=-1; x2<2; x2++){
         for(int y2=-1; y2<2; y2++){
           if(x2!=0||y2!=0){
             process(x,y,x+x2,y+y2);
           }
         }
       }
     }
     max=max(max,tempVisualization[x][y]);
     min=min(min,tempVisualization[x][y]);
     stroke(tempVisualization[x][y]);
     point(x,y);
    }
  }
  range=max-min;
  range=min(range,254);
  if(mode==1){
    growthfactor=range*0.7;
  }
  if(mode==0){
    for(int x= 0; x< width; x++){
      for(int y= 0; y< height; y++){
       visualization[x][y]= visualization[x][y]*growthfactor/range;
      }
    }
  }
  println("looped");
  visualization=tempVisualization;
}
public void process(int largeX, int largeY, int smallX, int smallY){
  if(visualization[largeX][largeY]>visualization[smallX][smallY]){
     tempVisualization[largeX][largeY]+=visualization[smallX][smallY];
   }
   else{
     tempVisualization[largeX][largeY]=tempVisualization[largeX][largeY]*growthfactor/range;
   }
}

The file type I was attempting to use if fits, which I know the library for in python but not java.